
Change Avatar
Venn Diagram

Venn Diagram
Play Turtle Diary's Venn Diagram game. It is just one of many exciting and interactive math games on Turtle Diary
What Is a Venn Diagram?
 Venn Diagrams are also called Set Diagrams or Logic Diagrams depending on where you’re using them. You’ll most often find them in mathematics and logic areas, but they began to be included in schools during the 1960s.
How Do We Talk About Venn Diagrams?
Here are the terms you’ll need to know:
Set: A collection of items; sets are denoted with braces or curly brackets { }Union: All items within a group of sets
Intersection Where two (or more) sets overlap to show a commonality
How Do You Use a Venn Diagram?
Comparing 2 Things In the Nguyen family, there are two siblings - Nita and Sam.
Nita’s favorite foods are ice cream, chocolate, and pizza.
Sam’s favorite foods are chocolate, brownies, and pizza.
Set N (Nita) = {ice cream, chocolate, pizza}
Set S (Sam) = {chocolate, brownies, pizza}
Create a Venn diagram here with a graphic like below with the information appearing as such:
N
N+S
S
ice cream
chocolate
pizza
brownies
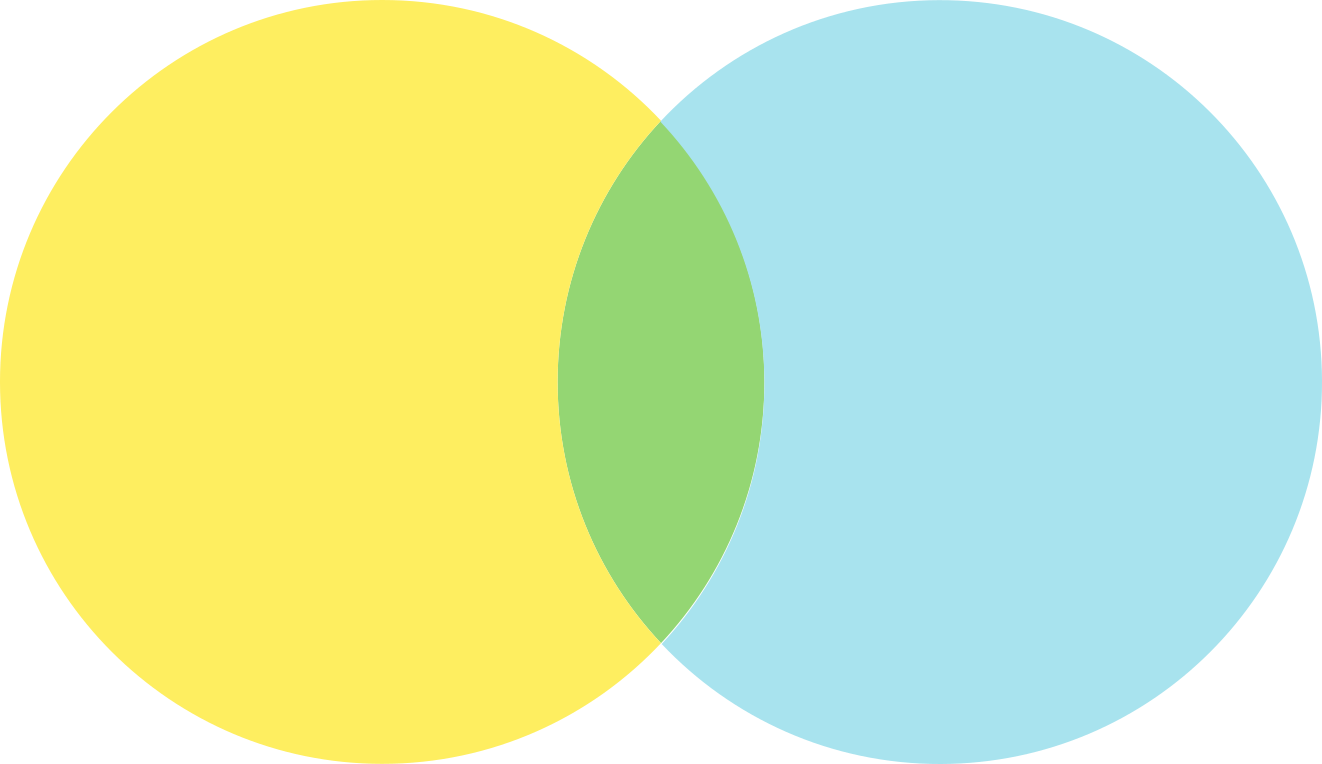
In using the Venn Diagram, we see that the Nguyen family includes two sets - N and S.
The union of those two sets includes all of the favorite foods in the diagram - chocolate, ice cream, brownies, and pizza - YUM!
The intersection of the two circles (sometimes called a subset) includes what they both have in common - a love of chocolate and pizza.
Comparing 3 Things Now let’s get more complex and add another family member, their cousin Ty.
Ty’s favorite foods are pad thai, chocolate, and sushi.
Set N (Nita) = {ice cream, chocolate, pizza}
Set S (Sam) = {chocolate, brownies, pizza}
Set T (Ty) = {pad thai, chocolate, ice cream}
Use an image like this, but flip it so that the yellow and blue match the diagram above.
N
T
S
ice cream
(N + T)
pad thai
(T)
brownies
(S)
chocolate
(N+T+S)
pizza
(N + S)
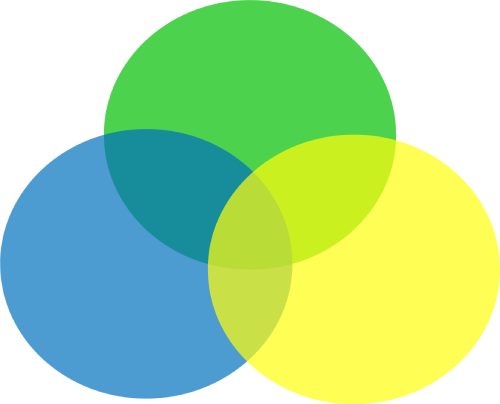
The diagram shows a visual representation of where their likes join, and where they differ. Let’s see what we can learn from this Venn Diagram:
1) All three like chocolate by the overlapping circle section in the center. A piece of each of their circles is within this area.
2) Nita & Ty both like ice cream.
3) Nita & Sam both like pizza.
4) Ty is alone in his love of pad thai, as is Sam in her love of brownies.
There’s much we can learn from a simple glance at a Venn Diagram that would take more time to figure out if all we had were the words.
When Should I Use a Venn Diagram?
There are lots of ways to use a Venn Diagram, but the easiest answer to this question is whenever you want to visualize the relationship between items.
They help you to compare two or more things and see more intricate relationships between the two than you may have been able to quantify before. This can include objects, people, ideas, concepts, and even sets of numbers.
Mathematicians often use them to solve complex mathematical problems.
Logic comes into play here, and Venn Diagrams help you reason through something called Boolean logic. This means using words like AND & OR to see how things are grouped.
Nita’s favorite foods are ice cream, chocolate, and pizza.
Sam’s favorite foods are chocolate, brownies, and pizza.
Set N (Nita) = {ice cream, chocolate, pizza}
Set S (Sam) = {chocolate, brownies, pizza}
Create a Venn diagram here with a graphic like below with the information appearing as such:
| N | N+S | S |
|---|---|---|
| ice cream | chocolate pizza |
brownies |
In using the Venn Diagram, we see that the Nguyen family includes two sets - N and S.
The union of those two sets includes all of the favorite foods in the diagram - chocolate, ice cream, brownies, and pizza - YUM!
The intersection of the two circles (sometimes called a subset) includes what they both have in common - a love of chocolate and pizza.
Comparing 3 Things Now let’s get more complex and add another family member, their cousin Ty.
Ty’s favorite foods are pad thai, chocolate, and sushi.
Set N (Nita) = {ice cream, chocolate, pizza}
Set S (Sam) = {chocolate, brownies, pizza}
Set T (Ty) = {pad thai, chocolate, ice cream}
Use an image like this, but flip it so that the yellow and blue match the diagram above.
N
T
S
ice cream
(N + T)
pad thai
(T)
brownies
(S)
chocolate
(N+T+S)
pizza
(N + S)
The diagram shows a visual representation of where their likes join, and where they differ. Let’s see what we can learn from this Venn Diagram:
1) All three like chocolate by the overlapping circle section in the center. A piece of each of their circles is within this area.
2) Nita & Ty both like ice cream.
3) Nita & Sam both like pizza.
4) Ty is alone in his love of pad thai, as is Sam in her love of brownies.
There’s much we can learn from a simple glance at a Venn Diagram that would take more time to figure out if all we had were the words.
When Should I Use a Venn Diagram?
There are lots of ways to use a Venn Diagram, but the easiest answer to this question is whenever you want to visualize the relationship between items.
They help you to compare two or more things and see more intricate relationships between the two than you may have been able to quantify before. This can include objects, people, ideas, concepts, and even sets of numbers.
Mathematicians often use them to solve complex mathematical problems.
Logic comes into play here, and Venn Diagrams help you reason through something called Boolean logic. This means using words like AND & OR to see how things are grouped.
Ty’s favorite foods are pad thai, chocolate, and sushi.
Set N (Nita) = {ice cream, chocolate, pizza}
Set S (Sam) = {chocolate, brownies, pizza}
Set T (Ty) = {pad thai, chocolate, ice cream}
Use an image like this, but flip it so that the yellow and blue match the diagram above.
| N | T | S |
|---|---|---|
| ice cream (N + T) |
pad thai (T) |
brownies (S) |
| chocolate (N+T+S) |
||
| pizza (N + S) |
The diagram shows a visual representation of where their likes join, and where they differ. Let’s see what we can learn from this Venn Diagram:
1) All three like chocolate by the overlapping circle section in the center. A piece of each of their circles is within this area.
2) Nita & Ty both like ice cream.
3) Nita & Sam both like pizza.
4) Ty is alone in his love of pad thai, as is Sam in her love of brownies.
There’s much we can learn from a simple glance at a Venn Diagram that would take more time to figure out if all we had were the words.
When Should I Use a Venn Diagram?
They help you to compare two or more things and see more intricate relationships between the two than you may have been able to quantify before. This can include objects, people, ideas, concepts, and even sets of numbers.
Mathematicians often use them to solve complex mathematical problems.
Logic comes into play here, and Venn Diagrams help you reason through something called Boolean logic. This means using words like AND & OR to see how things are grouped.


