What Is Frequency in Math Video
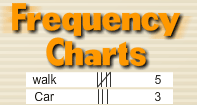
Frequency show how often each number comes up in your data. The frequency is how often something happens. In a frequency chart, you write all of the possible outcomes in one column and the number of times they occur in the data in the second column. To create a frequency chart, create two columns: Column 1, labeled with the type of data you're collecting (number of pets, test scores, heights, etc): List all the numbers that appear in your data. Column 2, labeled "Frequency": How often each number appears in the data.


